Today, 43% of Americans express a positive emotion about Donald Trump winning the election: 18% say they feel excited, while 25% say they are relieved. By comparison, in the days before the election, only 38% expected to feel one of these positive emotions, including just 12% who said they would be excited.
Still, a narrow majority of Americans (55%) have a negative reaction to Trump’s victory. Most of those unhappy with Trump’s win express disappointment (41% of the public), while 15% of Americans say they are angry about Trump’s election. On the eve of the election, a somewhat larger share of the public (23%) anticipated they would be angry if Trump won.
Fully 86% of Republicans and Republican-leaning independents now express either excitement (38%) or relief (48%) about Trump’s win, while just 13% say they are disappointed. During the course of the campaign, smaller majorities of Republicans said they would feel one of these positive emotions if Trump won, while closer to a quarter (22% in November, 25% in August) of Republicans said they would feel disappointed or angry. In particular, GOP excitement over Trump’s win is now much greater than expected (38% say they are excited, up from 24% on the eve of the election).
Though Democrats and Democratic-leaning independents remain overwhelmingly unhappy about Trump’s win, fewer express anger about it than did so when asked how they would feel if he won before the election. In September and November, about four-in-ten (42% and 39%, respectively) Democrats said they would be angry if Trump won. Today, about a quarter of Democrats (26%) say they are angry about his victory, while a greater share now say they are disappointed.
Among Republicans, excitement about Trump’s win is more pronounced among older people and those who backed Trump during the primaries.
About half of Republicans and Republican-leaning independents over 65 (51%) say they feel excited about Trump’s election, while just 23% of Republicans under 30 say the same.
Young Republicans are about as likely to say they are disappointed or angry (24%) about Trump’s win as they are to express excitement. The more common sentiment among this group is relief: 53% of young Republicans and GOP leaners say this.
And while 62% of Republicans who supported Trump in the Republican primary in a May survey are excited about his general election win, Republicans who supported other GOP candidates are less enthusiastic: 57% of Republicans who backed Trump’s primary rivals say they are relieved he won the general election, while just 26% say they are excited.
Most Democrats and Democratic-leaning independents feel disappointed about Trump’s win, but a greater share of college graduates express anger about his victory (38%, compared with 21% of those with less education). This gap is particularly pronounced among white Democrats: 45% of those with a college degree and just 20% of those without a college degree say they are angry Trump won.
Black Democrats are more likely (80%) than whites (59%) to express disappointment – and less likely to express anger – about Trump’s victory.
Nearly all voters say that if they could vote again for president they would choose the same candidate: 97% of all voters say this, including 99% of Trump voters and 96% of Clinton voters.
Slightly fewer Johnson voters (87%) say they would choose the same candidate if they could vote again for president, while just 8% say they would have voted for a different candidate.
Most voters who planned to vote for a third-party candidate before the election say they stuck with their choice in the post-election survey: 64% of registered voters who said in November that they planned to vote for either Johnson or Stein said in December that they voted for those candidates. Those who did not vote for their pre-election third party preference were equally likely to say they voted for Clinton as they were to say they voted for Trump.
In November, these third-party voters were about evenly split between those who said they would probably vote for the Democrat if it wasn’t Hillary Clinton (34%), would probably vote for the Republican if it wasn’t Donald Trump (30%) or would vote for Johnson or Stein no matter who the other candidates were (35%).
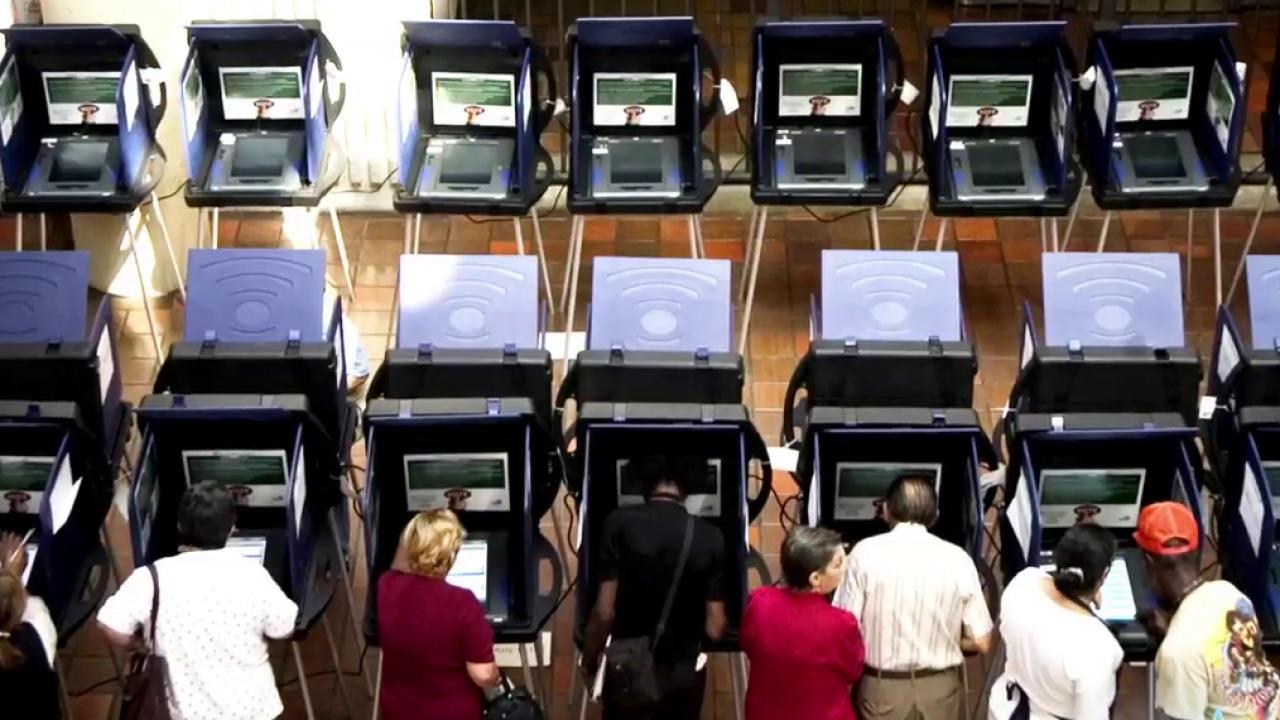
Much of the focus of the 2016 presidential election was on the people who turned out to vote, but a sizeable minority of Americans decided not to vote or were unable to do so. And among those citizens who say they did not vote on November 8, 44% say they wish that they had, while 55% say they do not.1
Among those who say they did not vote in the 2016 presidential election, no single reason stands out for why they did not cast a ballot. Offered a list of nine possible reasons, about one-in-four (26%) say that they “didn’t like any of the candidates,” while about as many (25%) say that they did not vote because they “did not think my vote would matter.”
Other reasons for not voting relate to timing: 18% say something came up that kept them from voting, while 17% say that they ran out of time.
About three-in-ten of those who say they did not vote also indicate technical or physical obstacles to voting: 22% say that they are not registered or not eligible to vote and 8% say that they physically could not get to the polls.
One-in-ten (10%) say that they tried to vote but were unable. About one-in-six (15%) nonvoters say that they were “pretty sure who would win” the election. And more generally, 14% report that they are “not that interested in politics” as a reason for not participating in the election.
There are few partisan or demographic differences among the reasons people give for not voting, but there are modest differences by age.
Notably, mentions that “I did not think my vote would matter” are higher among nonvoters under age 30 than among those 50 and older (33% vs. 13%) and young nonvoters are more likely than those 50 and up to say that they were “pretty sure who would win” (24% vs 6%).
 Those who say they did not vote are more likely to be younger, less educated and nonwhite than registered voters overall. About four-in-ten citizen nonvoters (41%) are under 30 years of age, compared with only 16% of all registered voters. And Hispanics make up a greater share of nonvoters than registered voters (20% vs. 11%); conversely, while 70% of all registered voters are white, just 52% of nonvoters are.
Just 12% of nonvoters are college graduates. Among registered voters overall, about a third (34%) are college graduates.
Nonvoters are less likely than all registered voters to say that they had conversations about the 2016 election. Only about half (47%) of nonvoters say they have talked with others about the 2016 presidential election over the previous week, while fully 69% of all registered voters have done this in the past week.
And fewer nonvoters (26%) than registered voters (41%) say that they had conversations about the economy in the last seven days.
On many other topics of conversation there is little difference between what registered voters and nonvoters communicate about. All registered voters and nonvoters are about as likely to say they had conversations about upcoming holiday plans (74% vs. 67%), health and medicine (57% vs. 51%), the weather (73% vs. 70%), food and nutrition (48% vs. 45%) or celebrity and entertainment news (21% vs. 20%).


Expositores: Oscar Vidarte (PUCP) Fernando González Vigil (Universidad del Pacífico) Inscripciones aquí. Leer más
Una retrospectiva para entender los próximos cuatro años. Leer más
En la conferencia se hará una presentación de los temas más relevantes del proceso de negociación se llevó a cabo desde el 2012, así como del acuerdo de paz firmado entre el Gobierno colombiano y la guerrilla de las FARC a finales del 2016. Se analizarán los desafíos y las... Leer más
El Observatorio de las Relaciones Peruano-Norteamericanas (ORPN) de la Universidad del Pacífico es un programa encargado de analizar y difundir información relevante sobre la situación política, económica y social de Estados Unidos y analizar, desde una perspectiva multidisciplinaria, su efecto en las relaciones bilaterales con el Perú.
© 2026 Universidad del Pacífico - Departamento Académico de Humanidades. Todos los derechos reservados.

